Top
10 Biggest Natural Disasters By Economic Damage
(Reference: statista.com)
Japan had the highest recorded economic loss till 2023 with $210 billion caused by an earthquake and subsequent tsunami in 2011, making it the biggest natural disaster by earthquakes. The Kobe earthquake in 1995 inflicted $100 billion of damage in Japan, while the Sichuan Earthquake in China in 2008 resulted in $85 billion economic loss.
 (Reference: statista.com)
The earthquake severity statistics indicate that the Fukushima earthquake in Japan in 2011, which caused a major nuclear disaster, led to an economic loss of $210 billion. The earthquake in Japan again in 1995 resulted in $100 billion damage. China, the USA, and Turkey were among the top 5 countries that experienced the most severe earthquakes, causing economic losses of $85 billion, $44 billion, and $34 billion, respectively.
Top 10 Natural Disasters By Death Toll
 (Reference: statista.com)
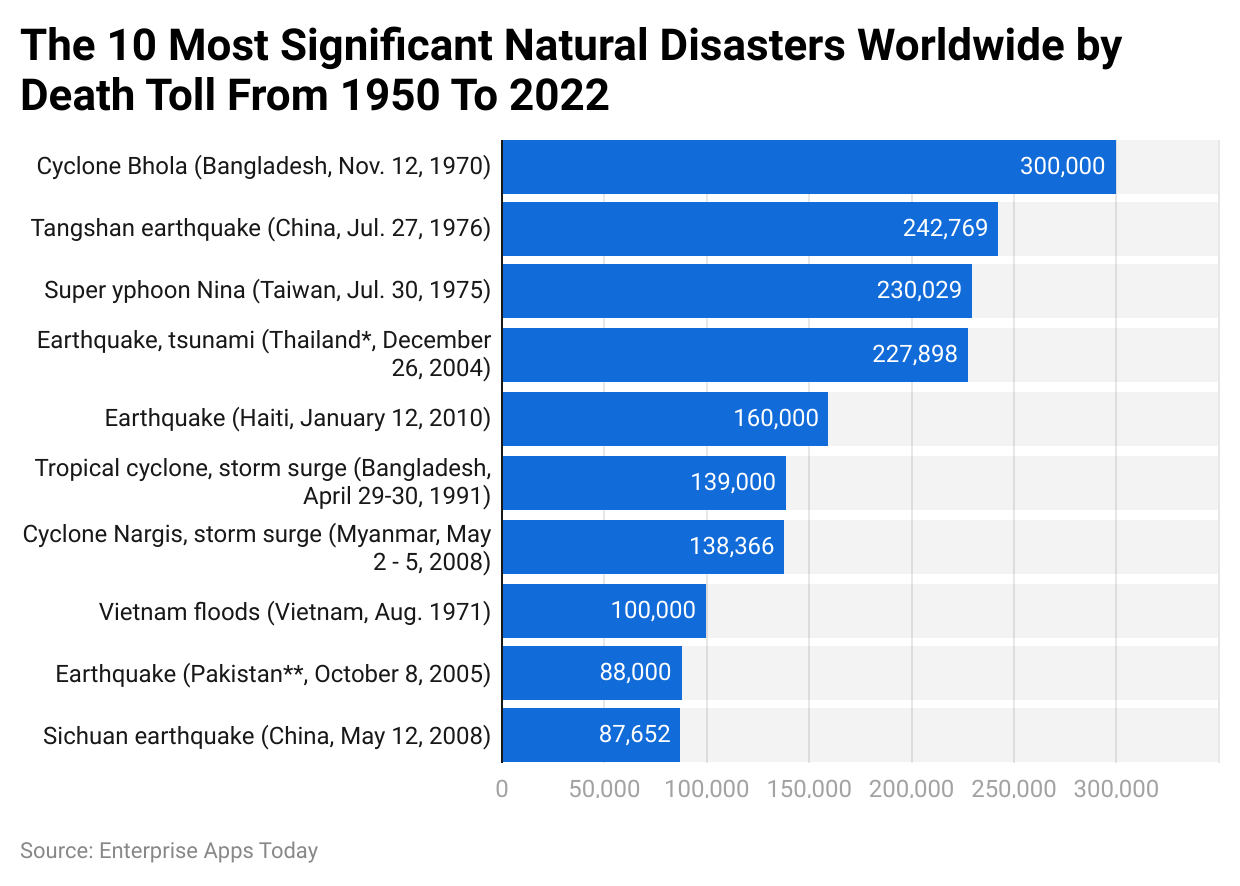
Half of the natural disasters causing deaths worldwide between 1950 and 2022 were earthquakes according to earthquake statistics. The Tangshan earthquake in China in 1976 resulted in 242,769 deaths. The earthquake in Thailand in 2004, followed by a tsunami, led to 227,898 deaths. This was followed by Haiti in 2010 with 160,000 deaths and China in 2008 with 87,652 fatalities.
Earthquake Statistics by Global Disaster Risk Index
 (Reference: statista.com)
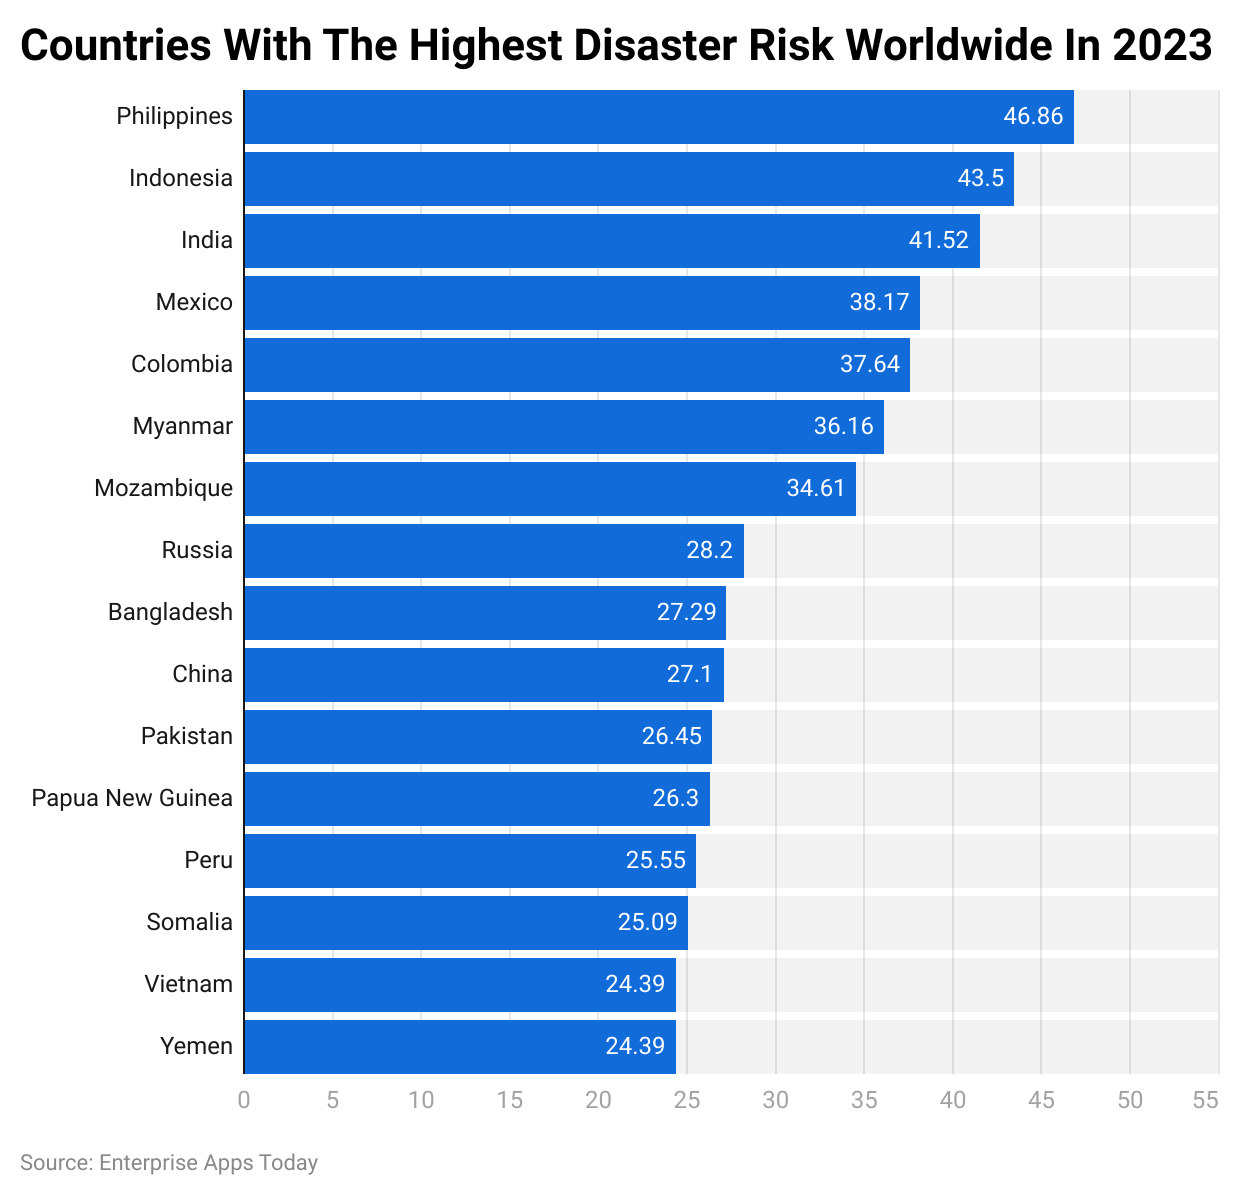
The Philippines ranked highest in the global disaster risk index 2023 with a WRI of 46.86, followed by Indonesia with 43.5 and India with 41.52. In 2023, more than 421 natural disasters were recorded worldwide, indicating a 23% increase over the past two decades. The top 10 countries with the highest global disaster risk index include Mexico, Colombia, Myanmar, Mozambique, Russia, Bangladesh, and China.
Earthquake Statistics Most Expensive Earthquakes In The USA For The Insurance Industry
Referencing statista.com
In 1994, California experienced the most expensive earthquake for the insurance industry, costing $31.2 billion in 2022 values. Additionally, California had two other costly earthquakes in 1906 and 1989, with costs of $8.039 and $2.280 billion respectively, adjusted for inflation. On average, California is the most heavily impacted area with the highest insurance payouts.
Earthquake Statistics By Magnitude
Referencing statista.com
Between 2000 and 2023, Earthquake Statistics 2023 show that 2011 had the highest number of earthquakes with magnitudes exceeding 5 on the Richter scale, totaling 2,481 recorded events worldwide. Similarly, 2007 and 2021 had 2,270 and 2,206 recorded earthquakes respectively.
Referencing statista.com
In 2023, the data on the strongest earthquakes globally indicate that Chile experienced the most potent earthquake, registering a 9.5 magnitude on the Richter scale in 1960. Additionally, Alaska in 1964 and North Sumatra in 2004 were hit by 9.2 and 9.1 magnitude earthquakes respectively.
Source: statista.com
Average Annual Deaths Occurred By Natural Disasters By Type
Source: statista.com
The statistics reveal that, on average, the number of deaths resulting from natural disasters varies by type.
Earthquakes Prone Countries Comparison of Vulnerability
Vulnerability and Resilience

(Source: statista.com)
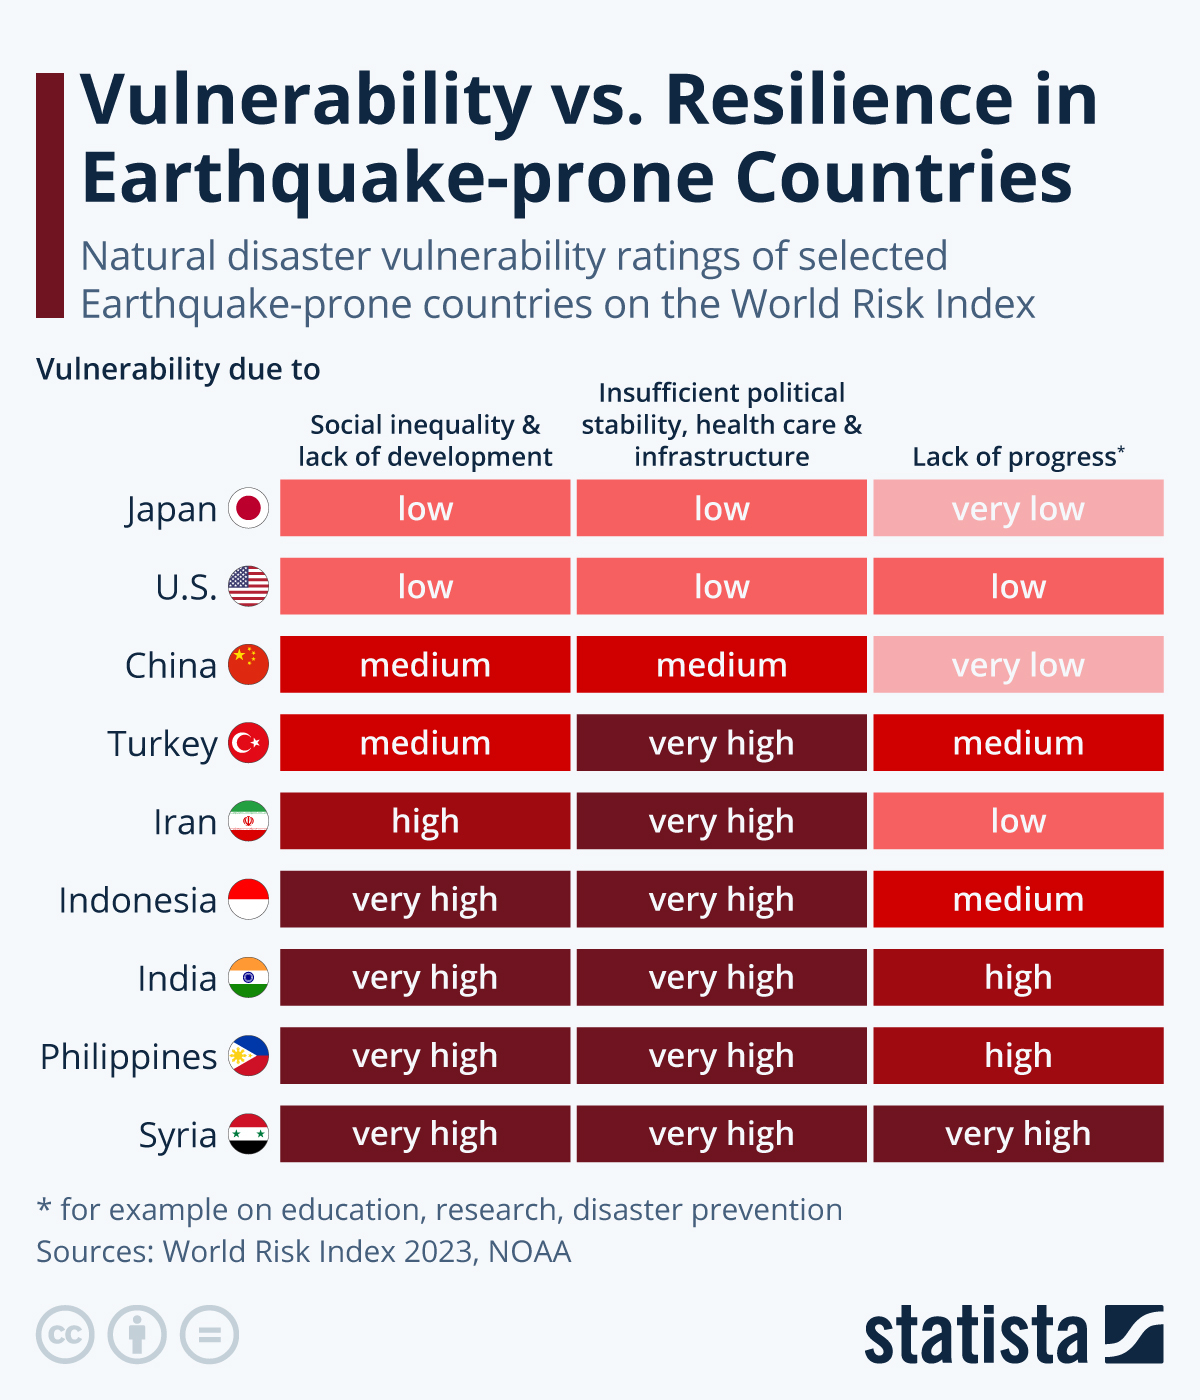
Syria, identified as highly vulnerable to earthquakes due to factors such as lack of progress, instability, poor health and infrastructure, social disparities, and underdevelopment, ranks high in the World Risk Index. Conversely, Japan, known for frequent earthquakes, has implemented effective measures to mitigate these vulnerabilities, earning a low-to-very low rating on the index.
Conclusion
While earthquakes are inevitable natural disasters, Japan has pioneered technologies to minimize their impact. Japan mandates the use of earthquake-resistant designs like Taishin Structure in buildings, adapting them to various building sizes as menshin or seishin, as determined by government regulations. Emphasizing the importance of technology in disaster management, adopting such measures is crucial to mitigate the effects of natural disasters.
[3px] border-t-[3px] p-4 border-[#1d598f] my-4″ style=”box-shadow: 0 0 14px rgb(9 38 66 / 8%);”>
Sources
Which countries are more prone to earthquakes and why?
The top 10 earthquake-prone countries are Japan, Indonesia,China, the Philippines, Iran, Turkey, Peru, the USA, Italy, and Mexico are countries more likely to experience earthquakes due to their proximity to tectonic plates that are in constant motion beneath the Earth’s surface.
“Why do Earth’s tectonic plates move?” – The movement of Earth’s tectonic plates is driven by the heat generated from radioactive processes, causing them to either move towards or away from each other.
“What is the Ring of Fire?” – The Ring of Fire, also known as the Girdle of Fire, Rim of Fire, or Pacific Ring of Fire, is a 40,000 km long and 500 km wide tectonic belt filled with earthquakes and volcanoes. This belt houses 90% of global earthquakes and 750 to 915 active or inactive volcanoes.
“Which is the safest place to hide during an earthquake?” – An open space without buildings or tall structures nearby is the safest place to seek shelter during an earthquake.
“The 7 tectonic plates” include the South American plate, Indo-Australian Plate, Antarctic plate, African plate, Eurasian plate, North American plate, and Pacific plate, each varying in size and named after the respective geographic regions they cover.
“What is an earthquake?” – Earthquakes occur when the Earth’s tectonic plates shift, creating seismic waves that can cause destruction. Seismographs are used to measure the strength and duration of earthquakes.
Author :
Publish date : 2024-08-29 19:22:00
Copyright for syndicated content belongs to the linked Source.
—-
Author : theamericannews
Publish date : 2024-08-30 06:26:19
Copyright for syndicated content belongs to the linked Source.